
Valuing Ethereum into the Merge
While negative sentiment in crypto is arguably at extreme levels right now, crypto is a fast-moving market and changes in the ecosystem are often catalysts for a significant shift in the narrative. One such change Cumberland is closely watching is the Ethereum Merge. Although there is no definitive date for this event as of yet, based on the latest core developer call as of last week, we currently expect the Merge to occur at some point in September or October.
What Exactly is ‘the Merge’?
The Merge essentially involves migrating the Ethereum blockchain from Proof of Work (cost intensive cryptographic mining) to Proof of Stake (where returns for validators are based on amount staked or delegated). This transition will involve a number of significant changes, most importantly network inflation shrinking from ~4% to ~0.5%, with the inflation allocated to stakers rather than to miners who currently sell ~80-90% of mining rewards to cover costs. Given the majority of fees are now burned (which has actually been the case since August last year), this drop in gross inflation should also result in the token becoming net deflationary. We believe this will result in a significant improvement in the coin’s demand/supply dynamics. The fees that were previously given to miners will then be granted as staking yield (along with inflation) which should result in mid-high single digit staking yields at least initially, likely attracting more capital into ETH, some of which will then be staked.
Why is the Merge Not Priced in?
Although we believe the high-level implications of the Merge are now fairly well understood, we don’t think the market has fully priced in this change. Until last week, this was driven less by a lack of confidence in the technical risks around the Merge itself and more due to the uncertain timing of the Merge, combined with a difficult macro-economic and geopolitical backdrop and the recent implosion of a major algorithmic stablecoin. Against this backdrop, we believed many investors had chosen to wait on the sidelines, even if that meant missing out on the initial upside.
Last week however, we saw two events which we think shook investor confidence. Firstly, there was a block reorganization on the Beacon (PoS) chain. Essentially the chain briefly forked and this appears to have been due to certain validators running out of date software. As this was not an issue for Mainnet (PoW) Ethereum, the market largely ignored it at the time. The following day however, a large short was placed using perpetual futures on Binance, which led to the ETH price falling by around $200 to $1730, though price subsequently recovered. Later that day, someone decided to exploit the Ropsten testnet by buying a large amount of hashpower (which is cheap on Ropsten as it’s a testnet), which increased difficulty per block and essentially triggered a Merge sequence (achieving Terminal Total Difficulty). As Ropsten doesn’t yet have a Beacon chain (planned for June 3rd), there was no way to monitor this and Ropsten essentially stopped producing blocks. This led to a further sell off, to just above $1700.
This issue is currently being fixed and should not be possible on Mainnet, but clearly there have been two minor technical issues in the space of a week along with material price volatility. Furthermore, following commentary from core ETH developers at the Permissionless conference two weeks ago, signaling a Merge delivery most likely in August (assuming no technical issues), there now appears to be a general consensus for a roughly 2 month delay of the difficulty bomb (which basically leads to PoW mining becoming uneconomical on the original chain, and a postponement most likely implies a delay for the Merge), largely to take pressure off the team into the final few weeks rather than due to anything more technically concerning (this based on last Friday’s core developer call but still formally undecided).
This is particularly relevant right now as sentiment is extremely weak and many crypto investors have moved into the most defensive assets (BTC and ETH) over the last few weeks. As such one could say investors are heavily long ETH, at least on a relative basis versus other assets. ETH like BTC was being favoured as a relative ‘safety trade’ and ‘store of value’ and it is understandable that concerns around the technical risks and timing of the Merge led to a sell off and move into BTC.
Our view on the above is that these issues were minor and largely due to lack of preparedness on networks that were not at this point meant to be fully production ready and while confidence may have been temporarily impacted we do not see anything of structural concern.
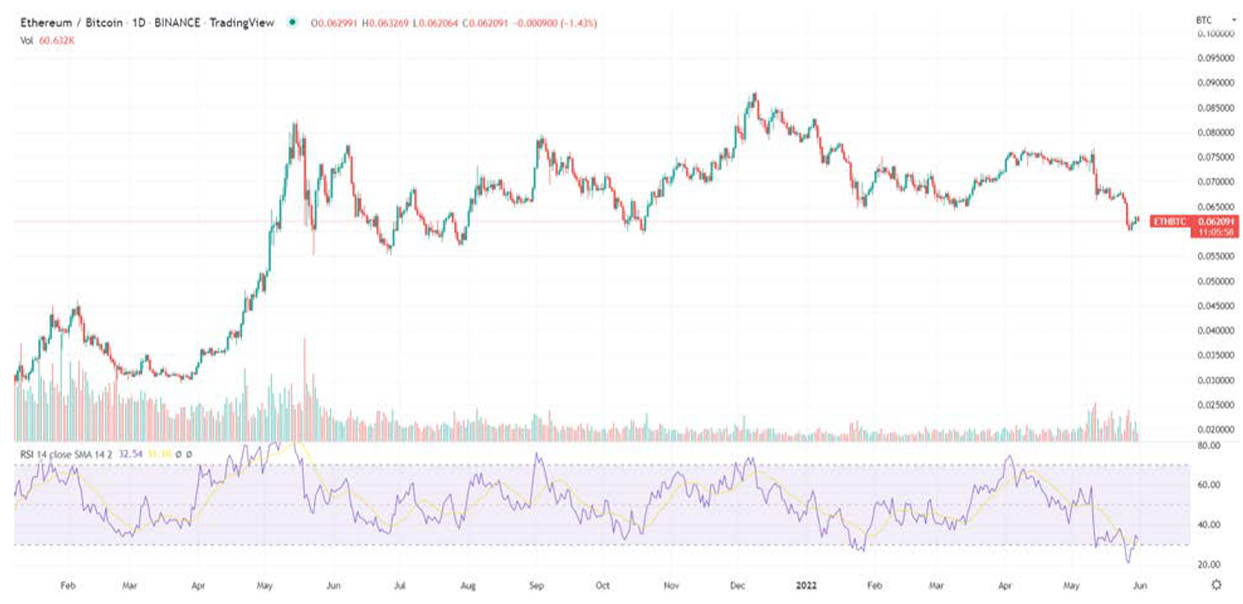
A key barometer for this sentiment is the ETH/BTC cross. Clearly this is now at fairly extreme levels, in our view pricing in technical risks and delay concerns and far from pricing in the bull case for the Merge. Note that the current forecast for the Ropsten testnet merge is for June 8th, after which the same process is scheduled to occur for the other two testnets. While the various shadow forks over the past few weeks have seen few technical issues, it is distinctly possible that these testnet merges (basically a dry run for the main event) may well lead to various technical hiccups, and with increasing investor scrutiny especially in such a weak market, this could be a further source of volatility for ETH.
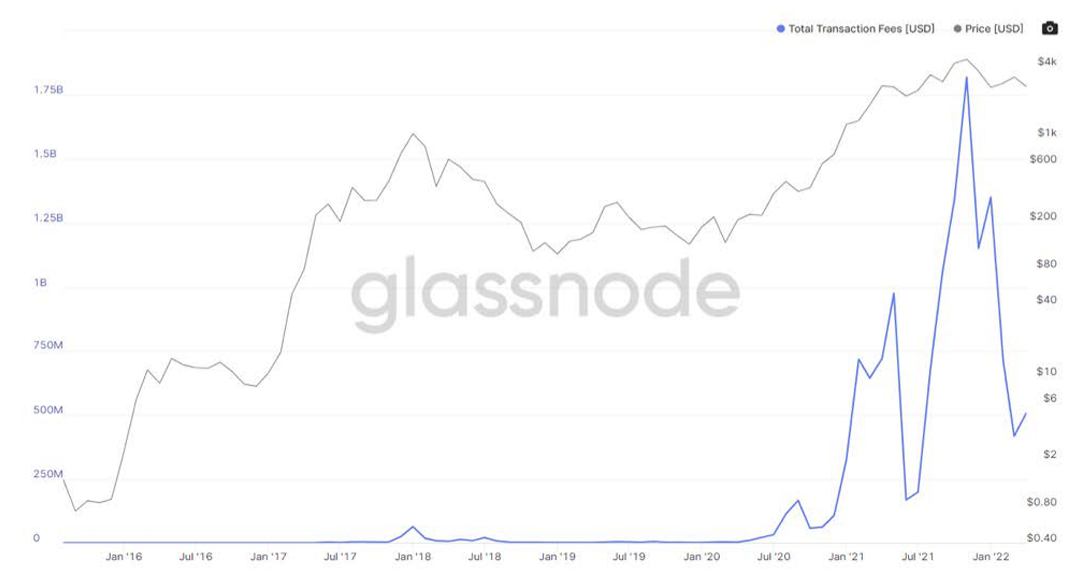
Adding to the weight of the market weakness and concerns over technical risks is a deterioration in some of the fundamental indicators. As the chart below illustrates, total transaction fees for April on Ethereum were down around 75% from the November 2021 peak, largely due to a decline in retail activity and a softening of NFT volumes. Although we feel this decline in activity is temporary, it understandably impacts valuations and forecasted staking yields post merge. Altogether, one could argue that investors do have some fundamental justification for being conservative right now, but we believe much of this ‘FUD’ (fear, uncertainty and doubt) is now priced in.
The purpose of this article is to approach a valuation for ETH in a quantitative fashion, using four methods to determine both the potential upside as well as the potential downside: demand/supply analysis, staking yield analysis, discounted cash flow (DCF) analysis and monetary value. No single method can be relied upon in a vacuum, but approaching the valuation from these four approaches tends to allow for some level of triangulation.
Demand/Supply Analysis
We start with a demand/supply analysis. Understanding demand/supply dynamics is of extreme importance in crypto, where price is often dictated in the short term at least by market imbalances, much more so than fundamentals.
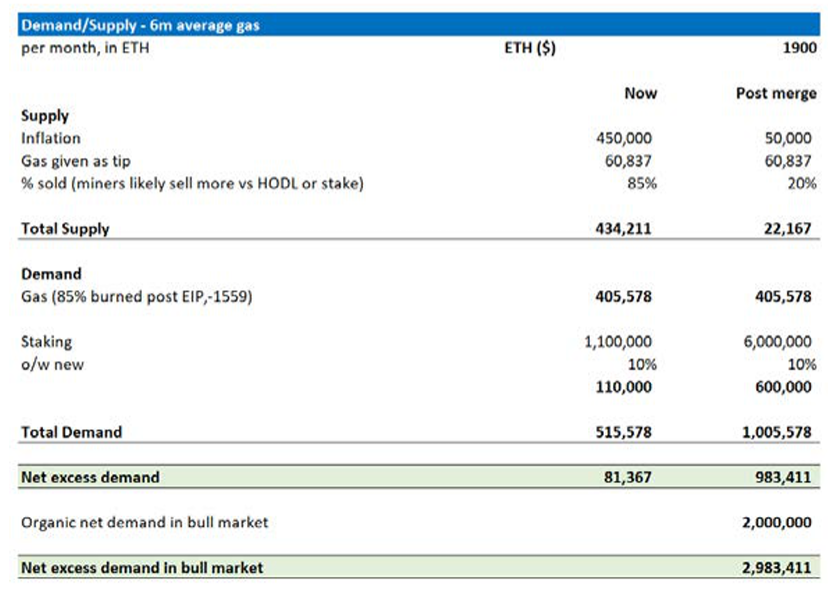
This is the analysis that is arguably the most persuasive, given the greater degree of near-term predictability. ETH inflation will drop from current issuance of ~4% to ~0.5%-0.6% post merge. We believe miners currently sell 80-90% of rewards to cover costs versus stakers, who we (very roughly) estimate will sell ~20%. Similarly, we anticipate staking will increase dramatically, pulling circulating supply out of the market. Most of this will be from existing owners, but we think it’s fair to assume some of this - conservatively 10% - will be net new demand. We assume 36m tokens are staked in the first 6 months to arrive at roughly 50m staked or ~40% of total ETH. This may result in some stakers queued at weaker initial yields given the validator queue limits the speed at which new ETH can be staked (discussed below in the staking yield section) but we believe stakers will be willing to accept this, especially if done through liquid staking platforms. Even if this 6m per month does turn out to be optimistic, we still believe that the excess demand from staking inflows should be material.
The above changes alone imply a move from a market that is roughly balanced now (80k ETH per month excess demand by our model) to around 1m per month in excess demand, which equates to ~10% of the ETH supply on an annualized basis.
As a stretch case, we could assume some incremental retail and institutional demand if the Merge triggers a bull market for ETH in Q4. This is tough to forecast, but if we look at HODL waves (using Glassnode data) which illustrate cohorts of coins by age, in blow off tops during Apr/May ’21 and Oct/Nov ’21, ~3% of supply moved to short term ‘new’ holders (defined as less than 1 month old), which we roughly use as a proxy for incremental retail demand. This will be met by supply, but only at a higher price. Alternatively, if we look at Q3-4 2020, short-term ownership went from 7.5% to 22.5% in 7 months, or ~2% per month.
Overall, this suggests that an incremental excess demand of ~2% of circulating supply per month is realistic assuming a buoyant market. This is clearly very hard to predict and would likely require a supportive macro environment, most likely requiring headline inflation to have subsided and/or a change in tone from the Fed.
In summary, as a base case we believe the market will see excess demand of 0.5-1% of supply per month initially, and up to 2.5-3% in a stretch case. Note that ~80% of ETH currently has a holding period of at least 3 months according to Glassdoor, which is near historical highs after consolidation periods. This suggests the investor base is fairly long-term oriented and stable, implying supply should be relatively tight from these cohorts and could exacerbate the price elasticity of any aggressive organic speculative demand.
Staking Yield Analysis
We then move to staking yield, which allows us to view ETH like a bond or more likely a high yield stock. The secondary deflationary aspect is of particular importance here as most competitor L1s with high single digit yields are still inflationary.
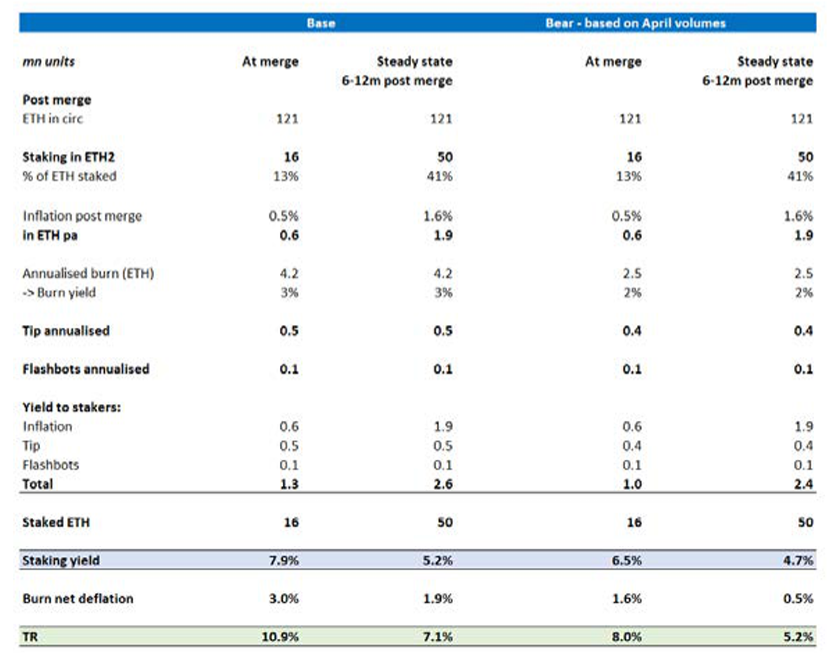
Post merge, around 85% of gas will be burned (as is currently the case), with the remaining ~15% ‘tip’ now granted to stakers, along with an inflation fee (~0.5%) and Flashbot bribes (minimal).
Current annualized burn, tip & bribes are ~2.5m ETH pa vs circulating supply of 121m. Given activity is currently limited, it’s helpful to look at a longer history: the current 6-month average is ~5m ETH annualized. At current activity levels, and assuming 16m ETH staked at the Merge (12.7m currently), we expect a yield of 6.5% + 1.6% deflation. If instead we return to activity levels averaged over the last 6 months, this yield would rise to 7.9% + 3% net deflation.
These estimates are roughly in line with the latest forecasts from core ETH developer Justin Drake.
Ethereum’s staking share (i.e. percentage of circulating supply that is staked) is particularly low versus the majority of L1s given likely lockup until several months post merge. In time we would expect to see increased staking which will dilute yields. We see yields falling to ~5% on a steady state basis at 50m ETH staked (41% of total ETH) given a significant increase in staking against similar levels of on chain activity. Over time though, with increased on chain activity and therefore revenue generation for stakers, yields should rise for a fixed level of staking.
There is some uncertainty around how quickly this could be achieved due to the validator queue. Basically, new validators must enter a queue as they come online (a new validator is needed for every 32 ETH staked), which may lead to significant wait times for later stakers. This is currently hard to forecast, but research from ARK suggests it could take around a year to reach 40-45% ETH staked. This could also possibly result in increased share to liquid staking derivatives (like Lido or Rocketpool), which would likely allow late stakers to ‘skip the queue’, with early stakers essentially subsidizing later stakers who would be invested in the liquid staking platform, but with their ETH not yet formally staked. The net effect would be weaker initial yields in these platforms, possibly subsidized with governance token incentives.
Discounted Cash Flow (DCF) Valuation
For the final two approaches, we examine longer term valuations and try to arrive at an absolute number for ETH, albeit extremely subjective.
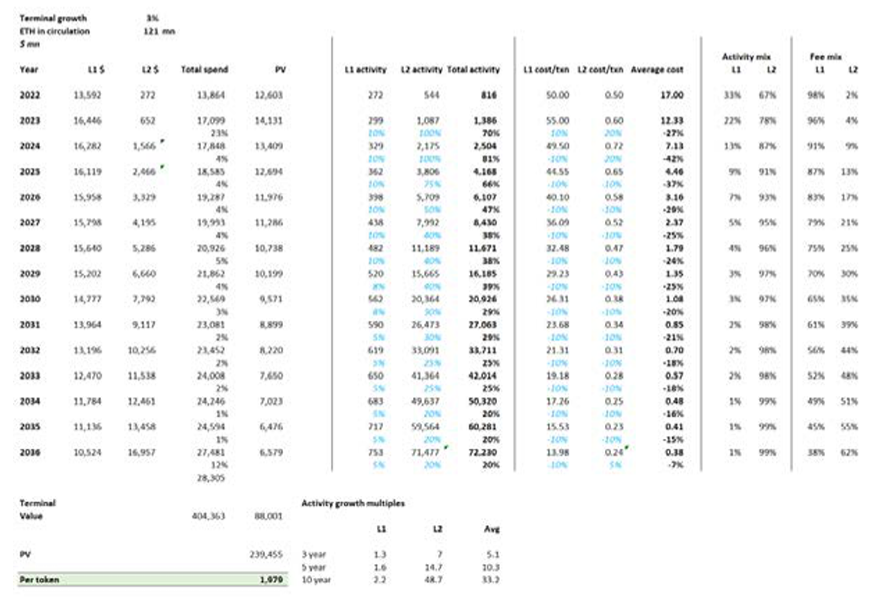
Here we examine the DCF of total fees paid that are either burned or given out as staking yield. It’s important to note that whilst a valuable exercise, this is extremely difficult to forecast across a range of assumptions, each of which have a significant impact on valuation.
The first variable is growth in L1 demand, which is complicated by the likely increase in L2 activity. We think initial forecasts of 50-100% pa for L2 activity are reasonable, but it is uncertain as to how much this will cannibalize L1 usage. As L2 cost per transaction is significantly lower than L1 (we estimate at ~$0.50 on average), this deterioration in mix could easily be revenue destructive unless we assume new activity to be generally incremental.
Using transaction data from Nansen, since the start of the year daily transactions on Arbitrum, Optimism and Polygon have delivered 200%, 130% and -30% growth respectively, while Ethereum activity is roughly down around 10% (year-over-year comparisons are difficult for L2s as there was negligible L2 activity in Q2 21).
We tend to think that Ethereum L1 activity will remain reasonably sticky and will gravitate toward higher value transactions (especially if for example, institutional-level financial transactions migrate to Ethereum). This should limit the negative impact of mix shift, with lower value transactions initially first moving to L2s.
The other ‘known unknown’ is cost per transaction. Absent any improvement in efficiency, incremental activity would generally imply greater demand for L1 blockspace and therefore higher pricing, but this is unrealistic - both for the L1 and rollups. There is likely to be a major improvement in throughput for Ethereum over the next two years due to sharding and we assume the efficiency benefits of Ethereum sharding begin to take effect from 2024.
There have also been other promising innovations such as danksharding, which essentially allows for execution and shard blocks to be built together, significantly increasing efficiency and lowering cost/transaction across L2s and the L1. The extent to which innovations like this lead to more activity and possibly market share gains from other L1s will determine how much activity offsets this drop in fees.
It is impossible to forecast the rate of throughput improvement over time, but as with most technologies we think it wise to assume a material drop in cost per transaction beginning in 2024, at which point we think dramatically improved scaling solutions are likely. So, for our model we assume a decline of 10% pa LFL, or ~25% on a blended basis. As a rough barometer, this is roughly in line with the historical ~30% pa drop in cost/GB for hard disk storage space which obviously led to huge increases in capacity and adoption.
And as with all DCFs, one has to assume a discount rate (we are assuming 10%, roughly in line with [yield + deflation]) and a terminal growth rate (3%) but this is enormously subjective.
This approach results in a very rough valuation of ~$2000/ETH, which is in the region of the current valuation, and a 5% 10-year CAGR in overall spend, against a ~45% CAGR in activity.
Monetary Value (MV=PQ)
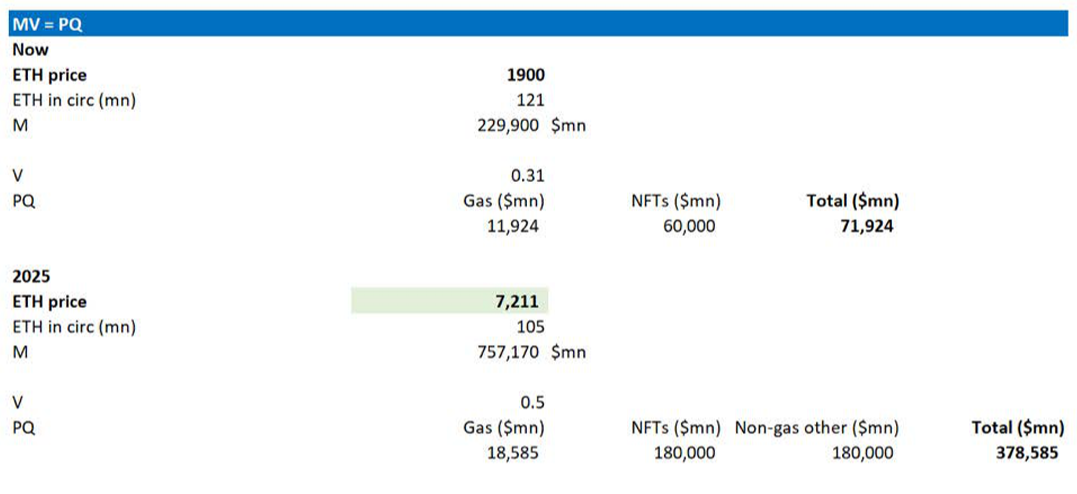
Finally, we use the Fisher equation to value ETH like a money supply. This is extremely subjective, but tries to build in some monetary premium given demand for ETH as a currency.
We start by assuming the current GDP of the ETH economy is equal to gas spend ($12bn pa based on 6m average) and NFT spend ($60bn pa).
The velocity of money is therefore 0.3x (GDP/money supply), which compares to 1x for the US dollar but reflects the impact of buy and hold investor share.
We use this approach to try and model spend in 2025. Using our DCF forecasts, we forecast gas spend ~55% above current levels due to L2 growth and LFL price declines. We apply 3x to current spend for NFTs (assuming some realworld IP is developed), and the same spend for ‘other’ ETH to account for new markets. We also assume a velocity of 0.5 given more transactional use.
This leads to a 2025 ETH ‘GDP’ of $380bn, which is roughly 5x the current levels and for context, equivalent to the current GDP of the Philippines. This seems broadly plausible to us and implies an ETH price of $7200.
Conclusion
While longer-term valuations (DCF and MV=PQ) are clearly extremely subjective and should therefore be taken with a heavy pinch of salt, we arrive at a valuation of $2000-$7200. We do place a much greater weight on both the staking model and the demand/supply analysis, primarily given the much greater degree of near-term predictability. Even with a wide margin of error, the data suggests ETH will offer initial stakers total returns above 5%, which we believe will draw in capital.
Similarly, we believe the demand/supply dynamics will lead to a major shift in market technicals. This should have a material impact on price, especially if supported by retail and institutional inflows, and hopefully a more conducive macro backdrop.
The key long-term bear argument as we see it is the potential for a major drop in revenue generation due to increased network efficiency, as shown in the DCF analysis. As with other technologies (semiconductors, internet access, mobile phone pricing), a material drop in pricing will hopefully be a key enabler for mass adoption, which should more than offset the lost revenue and open up a wide range of use cases as yet unconceived. This would also likely result in a major shift in token value generation from revenue and yield generation to utility demand. The macro environment is uncertain and challenging. Meanwhile many alt coins are seeing material token unlocks this year and underlying fundamentals such as demand for leverage, trading activity and stablecoin growth are arguably harder to predict and frankly more pessimistic after the recent Terra collapse. Meanwhile, we see ETH as one of the few names in crypto with improving fundamentals. As such we see ETH offering one of, if not the most attractive risk/reward setups in crypto right now.
The information (“Information”) provided by Cumberland DRW LLC and its affiliated or related companies (collectively, “Cumberland”), either in this publication or document, or on or through https:// cumberland.io/, is for informational purposes only and is provided without charge. Cumberland is not and does not act as a fiduciary or adviser, or in any similar capacity, in providing the Information, and the Information may not be relied upon as investment, financial, legal, tax, regulatory, or any other type of advice. The Information is being distributed as part of Cumberland’s sales and marketing efforts. Cumberland makes no representations or warranties (express or implied) regarding, nor shall it have any responsibility or liability for the accuracy, adequacy, timeliness or completeness of, the Information, and no representation is made or is to be implied that the Information will remain unchanged. Cumberland undertakes no duty to amend, correct, update, or otherwise supplement the Information. In addition, any person wishing to enter into transactions with Cumberland must satisfy Cumberland’s eligibility requirements.
The Information has not been prepared or tailored to address, and may not be suitable or appropriate for the particular financial needs, circumstances or requirements of any person, and it should not be the basis for making any investment or transaction decision. THE INFORMATION IS NOT A RECOMMENDATION TO ENGAGE IN ANY TRANSACTION. The virtual currency industry is subject to a range of risks, including but not limited to: price volatility, limited liquidity, limited and incomplete information regarding certain instruments, products, or cryptoassets, and a still emerging and evolving regulatory environment. The past performance of any instruments, products or cryptoassets addressed in the Information is not a guide to future performance, nor is it a reliable indicator of future results or performance. Investing in virtual currencies involves significant risks and is not appropriate for many investors, including those without significant investment experience and capacity to assume significant risks. Any person seeking to invest in or trade virtual currencies should do so only after engaging in their own research and obtaining their own advice as to whether virtual currencies may be appropriate in the context of their individual circumstances.
Cumberland is a principal trading and market making firm, and Cumberland may be subject to certain conflicts of interest in connection with the provision of the Information. For example, Cumberland may engage in transactions in a manner inconsistent with the views expressed in the Information, and transactions entered into by Cumberland could affect the relevant markets in ways that are adverse to a counterparty of Cumberland. If any person elects to enter into transactions with Cumberland, whether as a result of the Information or otherwise, Cumberland will be acting solely in its own best interests, which may be adverse to the interests of such persons.